August 2, 2020
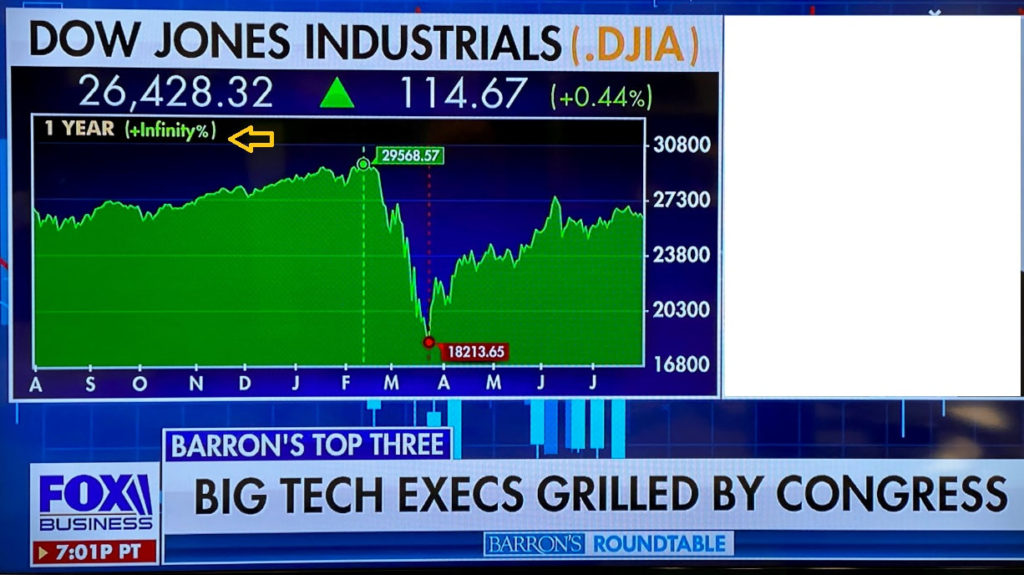
As part of a my investment process, I always read Barron's weekly Saturday morning magazine. I catalog each article and its author. After reading each of interest, I summarize the bull and bear case. I also re-evaluate portfolios to see how this information impacts future returns. For recently, I've also been watching Barron's weekly 30 minute recap of its magazine on the Fox Business Network. It's entertaining and sometimes includes...
Read More →July 28, 2020
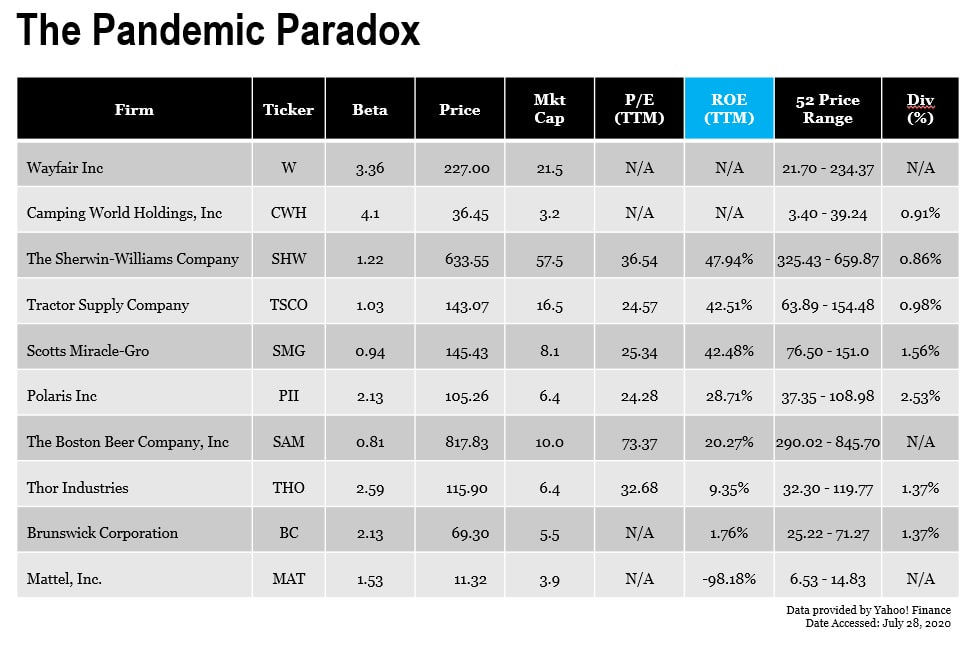
In tonight's episode of Mad Money, 10 stocks were discussed which, paradoxically, have risen in price despite their seemingly consumer discretionary nature.
Read More →July 27, 2020

Show notes from Mad Money's CNBC Monday night broadcast of The Game Plan are enriched with price, yield, market capitalization, P/E ratio for the trailing twelve months & 52 week high via Yahoo Finance.
Read More →July 19, 2020
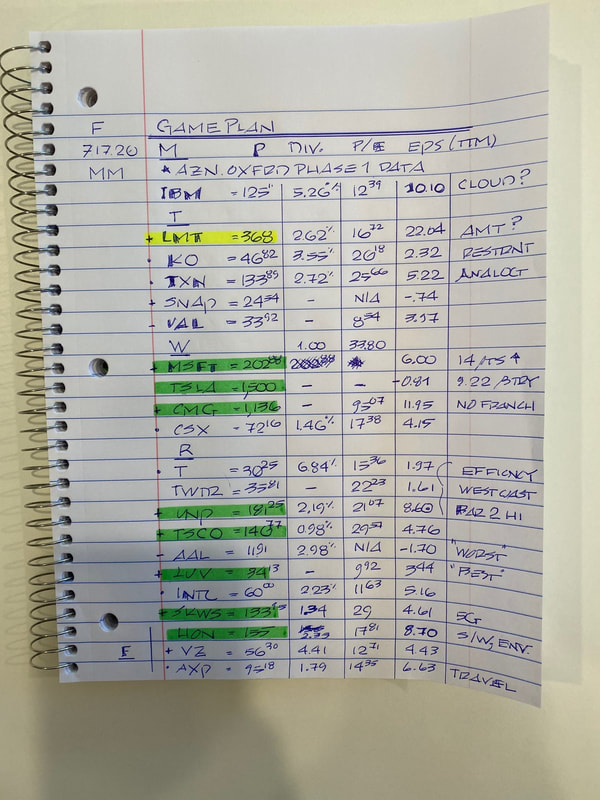
I've always enjoyed watching Mad Money Friday Game Plan segments.Last Friday's tickers extended with prices, dividends, P/E ratio, EPS (TTM) & notes via Yahoo! Finance.
Read More →July 8, 2020
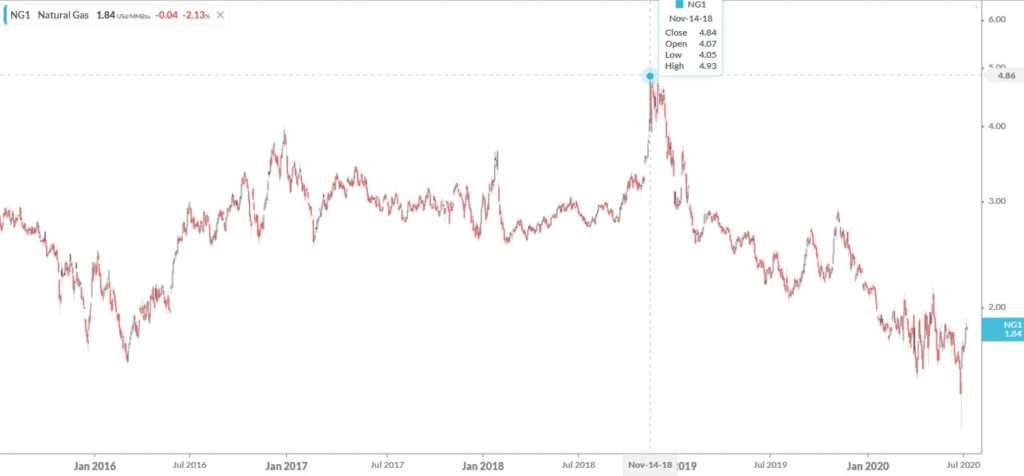
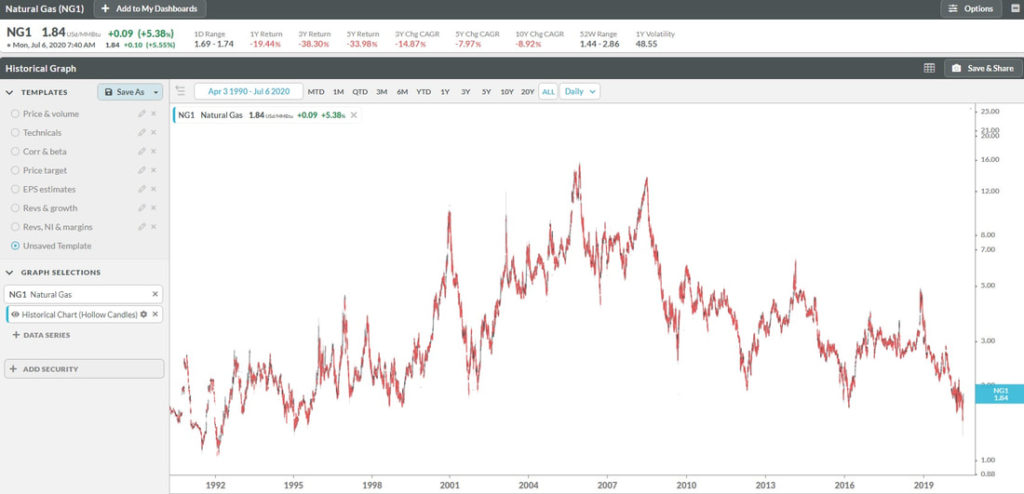
Interesting article in today's WSJ about the global natural gas industry. Natural Gas (NG) On June 25, 2020, natural-gas futures for July 2020 delivery closed at a 25 year low of $1.482 per million British thermal units. And, this price represented the lowest June price every in the United States. On July 7, 2020, NG futures for August 2020 delivery closed at $1.876 which represents a 27% increase since June 25,...
Read More →July 1, 2020
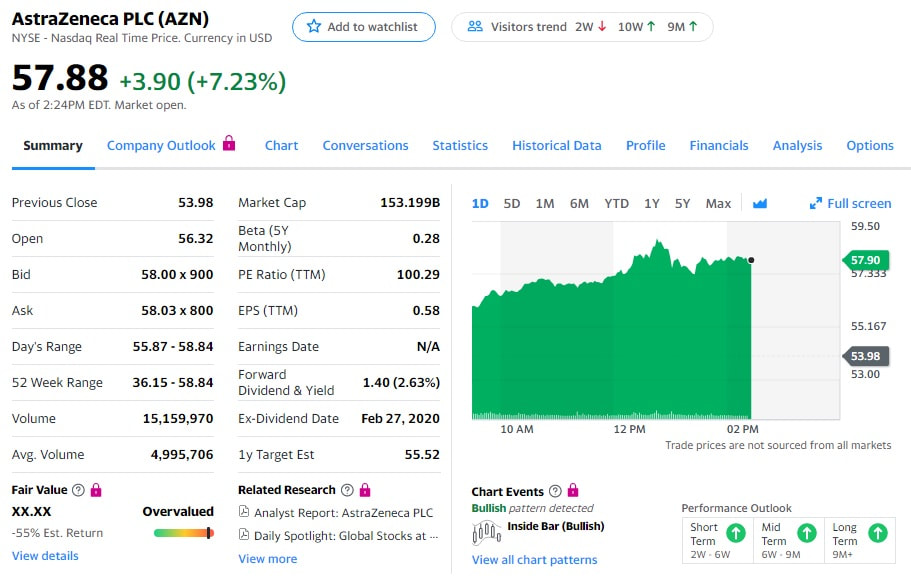
Interesting News: $AZN shares & call options ($65 strike, August 21, 2020) rose this morning on an "anonymously sourced report from a prominent British journalist claiming the medical journal the Lancet will publish positive news soon on the Covid-19 vaccine the company is developing with Oxford University." Options rose from 0.70 to as high as $1.40 this afternoon (Wednesday, July 15, 2020) per Yahoo Finance! Full story available here:https://www.barrons.com/articles/astrazeneca-stock-jumps-on-report-of-positive-data-on-covid-19-vaccine-trial-51594826588
Read More →June 30, 2020
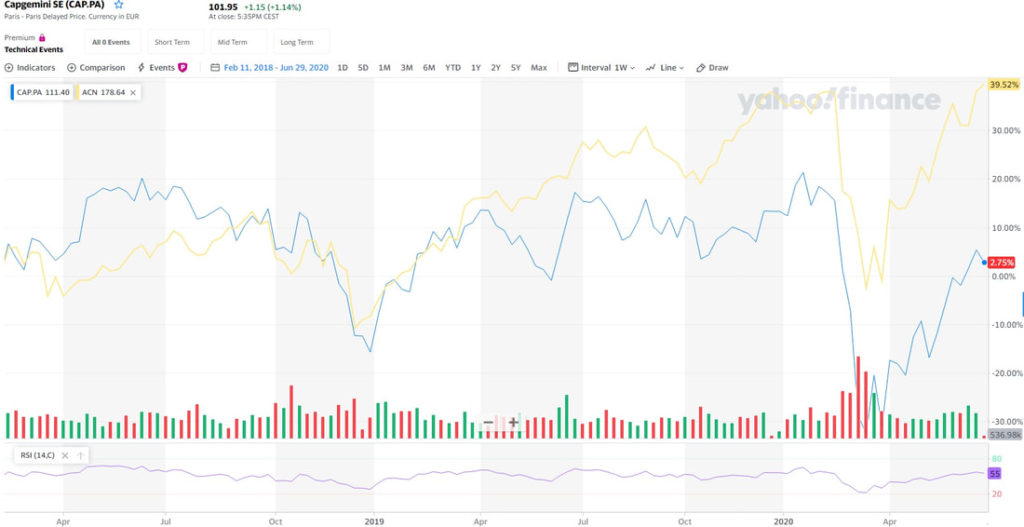
$ACN equity significantly outperforming $CAP.PA since February 2018.
Read More →June 29, 2020
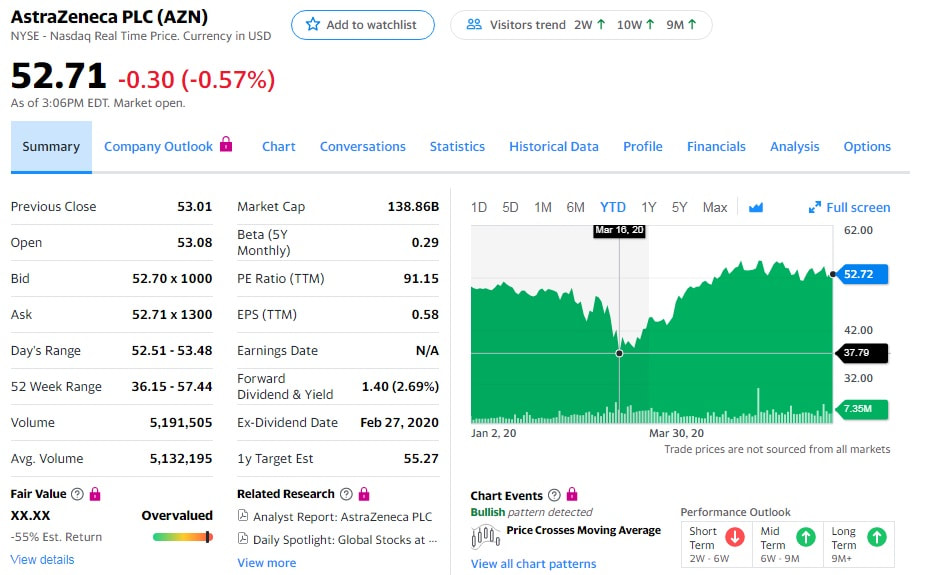
Noticed an unusual level of call option volume in $AZN August 65 strike calls.
Read More →April 13, 2020
Did the bottom happen?A key question that investors are asking is will the low of the current market cycle be 2,187? There are certainly a lot of unknowns as the first quarter earning season is in full swing. Debt has certainly increased for many corporations & sovereigns.Cost of social distancing & related work practice changes will most likely increase corporate compliance costs.Firms will most likely issue new equity, diluting existing...
Read More →April 13, 2020
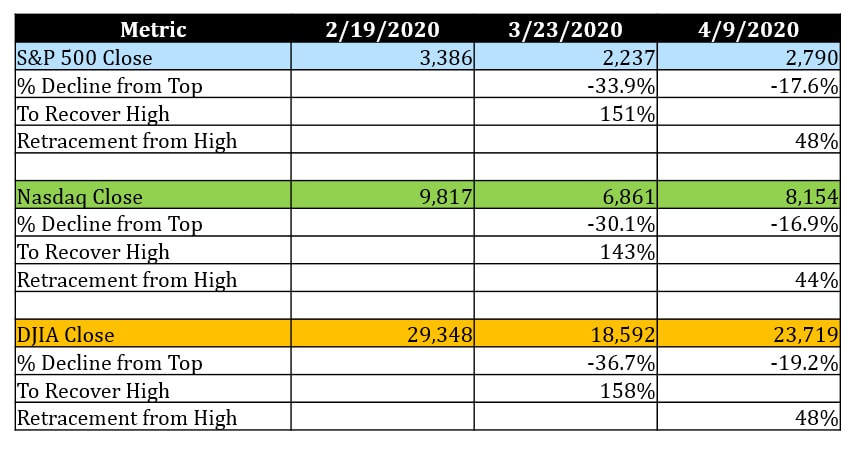
Checking out some pre-market metrics including peak-to-trough declines (%)percentage gain to breakeven (%)retracements (%) as of Thursday, April 9, 2020 close Will the S&P 500 continue its current uptrend? Or, is this simply a bear market rally?
Read More →April 9, 2020
8:30am ET. The US Labor Department reported 6.6 million Americans filed first-time unemployment claims in the week ended April 4, 2020 versus a consensus estimate of 5.0 million. This brings the total number of jobless claims over the past three weeks to more than 16 million. This contrasts to the six-month period prior to a shutdown where, U.S. nonfarm payroll growth had averaged 221,000 a month.
Read More →April 5, 2020
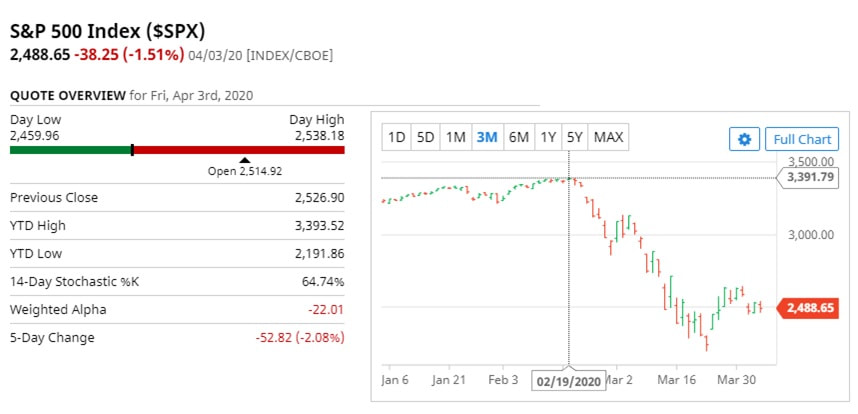
The consensus is for the S&P 500 to retest the March 23, 2020 lows. More dire forecasts indicate a coronavirus low in the 1500 - 1800 range. Factors to consider: Duration of U.S. economic shutdownEffectiveness of social distancingAnti-viral treatmentHerd immunityConsumer behaviorSmall-business appetite for riskImpact of Fiscal InterventionLikelihood of virus resurface in the Fall 2020Likelihood of vaccine in Fall 2021U.S. November 2020 ElectionLiquidity vs. solvency for a significant number of U.S....
Read More →March 26, 2020
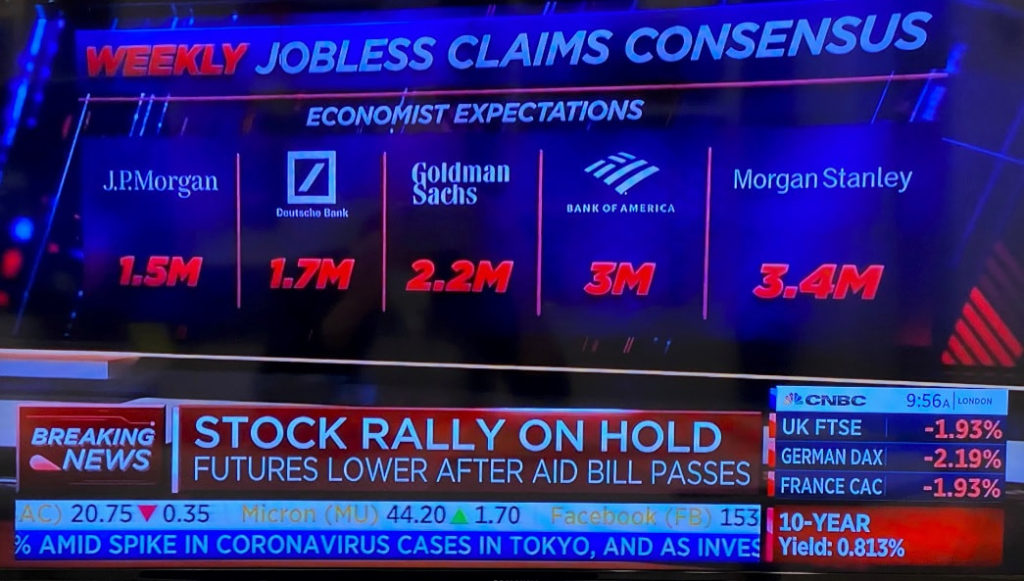
Pre-Market Observations Jobless ClaimsInterested to see today's 8:30am Initial Jobs Claims.My economic model indicates 2.5M vs. Brokerage Bulge Bracket Firms below. AppleAAPL ($244) may delay 5G production. How will this affect the one-year value of the equity? BoeingBA ($160) gained 25% yesterday. What will the equity price at in two years? PaychexPAYC ($59.99). How will the effects of COVID-19 impact the equity in 1 year?
Read More →March 23, 2020
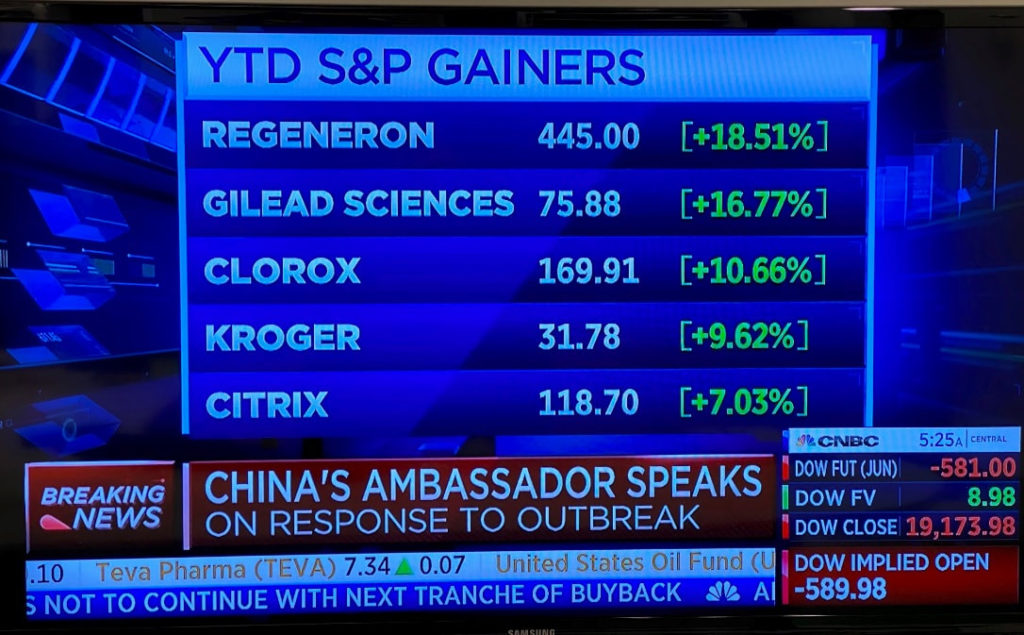
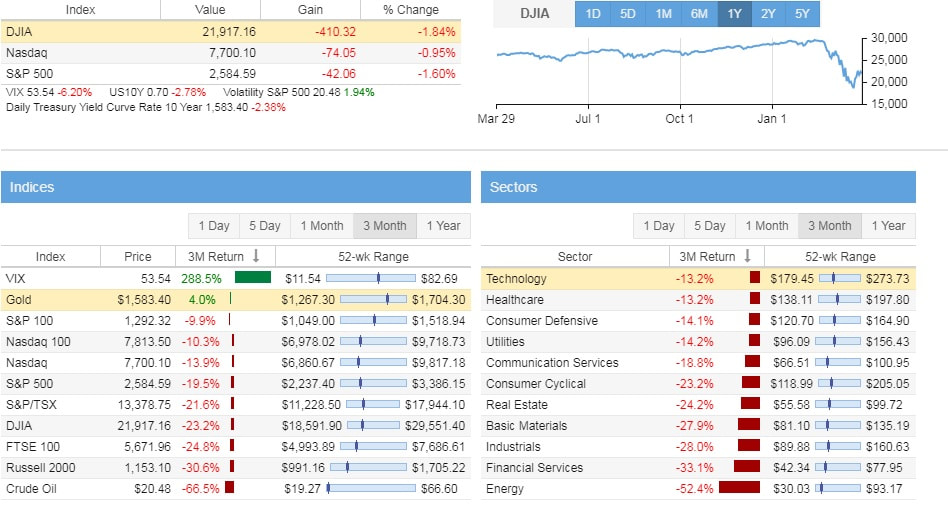
Where will financial assets be one year from today?Currently, some view a possible 30% unemployment rate in Q2 2020 and then a subsequent rebound in Q3 & Q4. Assets are re-pricing due to real & expected changes in risk Revenue (Demand) RiskEarnings RiskInterest Rate RiskCredit RiskLiquidity Risk 2020 YTD Gainers: U.S. Treasury Market Yields U.S. Index
Read More →March 14, 2019
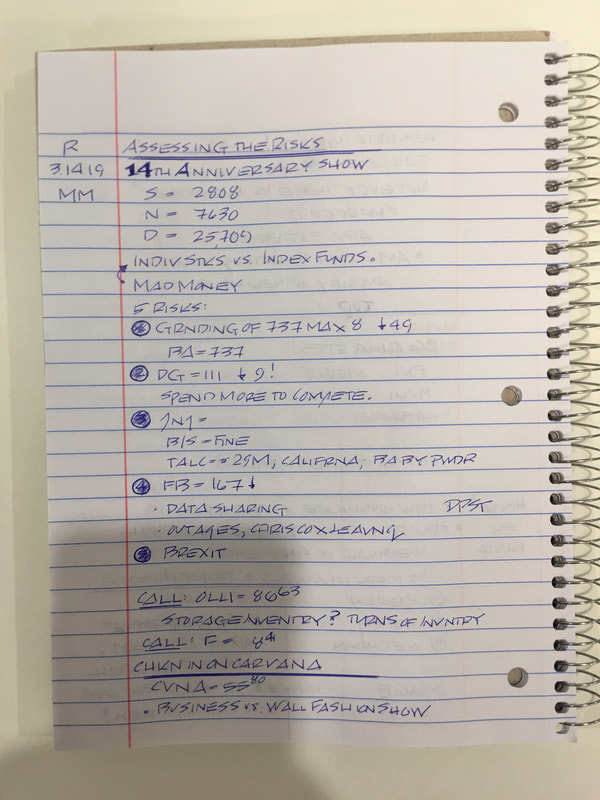
My sketchnotes from today's broadcast of CNBC's Mad Money financial news program.
Read More →September 22, 2018
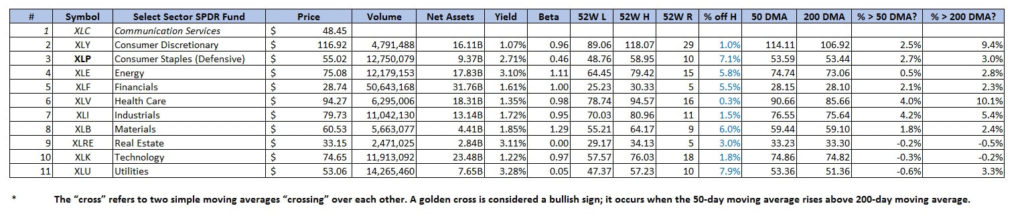
Analysis of the 11 Select Sector SPDRs which represent the S&P 500 as a whole. Sources:http://www.sectorspdr.com/sectorspdr/http://www.sectorspdr.com/sectorspdr/tools/correlation-trackerYahoo! Finance
Read More →September 22, 2018
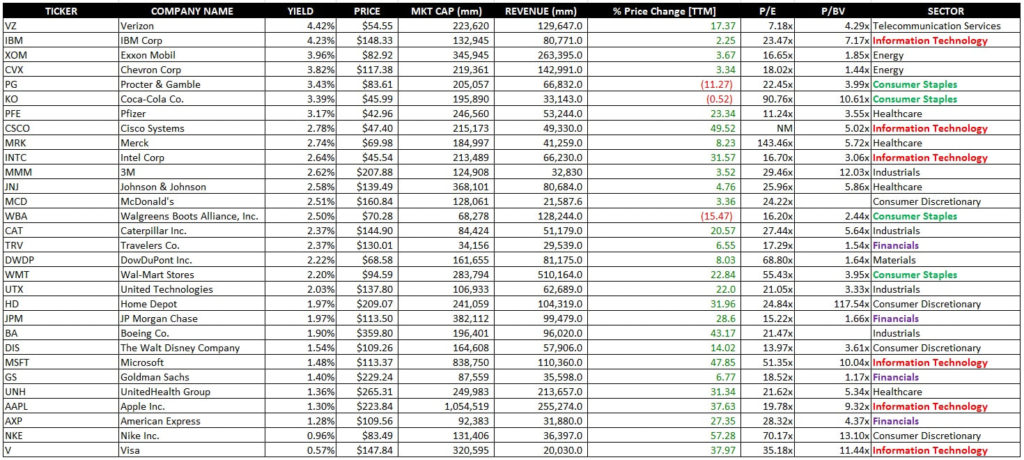
Analyzing the DJIA reveals the following insights: 9 of 11 GICS industry sectors represented. The missing sectors are Real Estate & Utilities.The equal-weighted yield is 2.39%The total market capitalization is $7.3 trillion$AAPL's market capitalization represents 14% of the totalA sector composition analysis indicates that Information Technology represents 38% of the total Source Data via Yahoo! Finance. Accessed September 15, 2018.
Read More →September 22, 2018
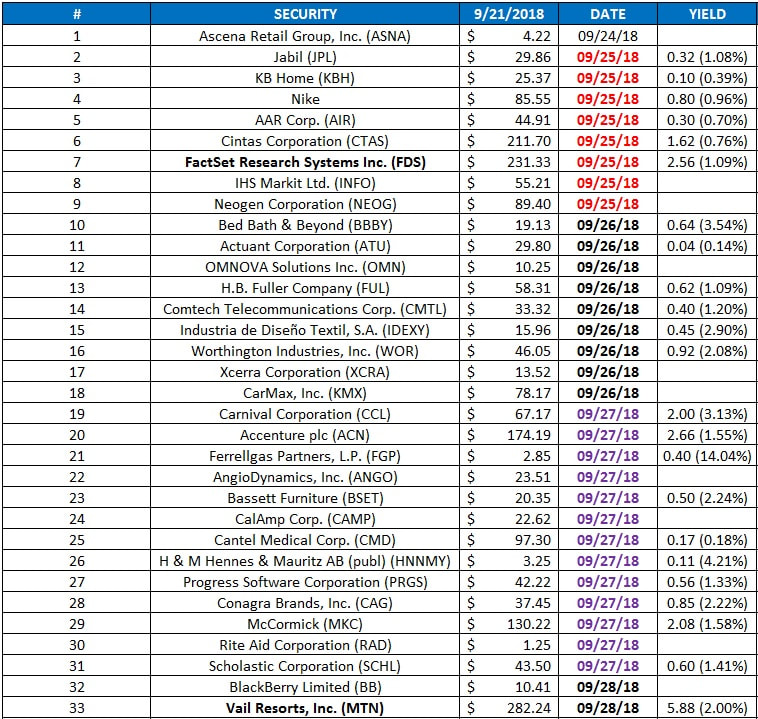
Checking out 33 companies which will be reporting financial results this coming calendar week: September 24, 2018 through September 28, 2018. Source: Yahoo Finance, Zacks Investment.
Read More →April 20, 2013
$APPL shares closed at $390/share on Friday, April 19, 2013. The market capitalization is $367B.Shares outstanding are: 939M.Balance Sheet Cash: $137B.Last year’s (September Fiscal Year End) earnings per share: $44.15/share.This year’s estimated earnings per share: $43.58/share.Current dividend yield = 2.7% So, $AAPL is trading at (390/43.58) 8.9x forward earnings.Ex-cash, $AAPL is trading at 5.6x forward earnings.And, investor sentiment is low primarily due to increased competition and expectations that new products (e.g.,...
Read More →